
| Density, ρ | Spec. Volume, ν |
|---|---|
Gasoline and kerosene may both be liquid fuels, but they do not behave the same way. Their density changes with temperature, product grade, and blend. That matters in storage, shipping, fuel handling, quality checks, and everyday reference work. A small change in density can turn into a real difference in weight, volume, and how the liquid is read on a chart.


✍ This calculator is built to make that job simple. Pick the unit system. Set the temperature. Set the base density. Then read the table and watch the live graph. The screen shows the current density and specific volume right away, so the user does not have to estimate or hunt through separate references. That makes it practical for field work, shop work, lab work, and quick comparison.
Table of Contents
What this page is for
This page is a reference tool for people who need a fast density check for gasoline or kerosene. It helps answer basic questions like how dense the fuel is at a given temperature, how much volume a given mass will fill, and how much the reading shifts when conditions change. It is not trying to be fancy. It is trying to be useful.
The calculator is especially handy when a user needs a quick value without digging through a handbook. The live chart gives a visual trend. The table gives a clean reading. The unit switch makes the whole thing work in both Imperial and Metric formats. That is the kind of setup that saves time.
How to use the calculator
The workflow is straightforward.
- Choose Imperial or Metric.
- Set the temperature.
- Set the base density for the fuel.
- Read the density and specific volume in the table.
- Check the graph to see the trend across the selected range.
That is all most users need. The calculator is designed so the current reading is always visible, and the graph updates as soon as the input changes. That way the user does not have to stop and recalculate each time the temperature moves.
Main terms on the screen
| Term | Plain meaning | Why it matters |
|---|---|---|
| Density | How much mass fits into a given volume | Used for fuel weight and volume estimates |
| Specific volume | How much volume belongs to a given mass | Useful for conversion and storage planning |
| Temperature | How warm or cold the fuel is | Density shifts as temperature changes |
| Base density | The reference density at 20°C or 68°F | Used as the starting point for the calculation |
| Pour point | The temperature where the fuel stops flowing well | Important for cold weather use |
Simple formulas that matter
The page is easier to use when the basic formulas are clear.
| Formula | What it means |
|---|---|
| Density = mass / volume | How tightly the fuel is packed |
| Specific volume = volume / mass | How much space 1 unit of fuel mass takes |
| Mass = density x volume | How much fuel mass is in a tank or container |
| Volume = mass / density | How much space a known mass will fill |
These are the 4 formulas that show up again and again in fuel work. A tank volume, a fuel mass, a truck load, a drum fill, a batch estimate, all of it comes back to the same basic idea. Density links mass and volume.
Why gasoline and kerosene are not the same
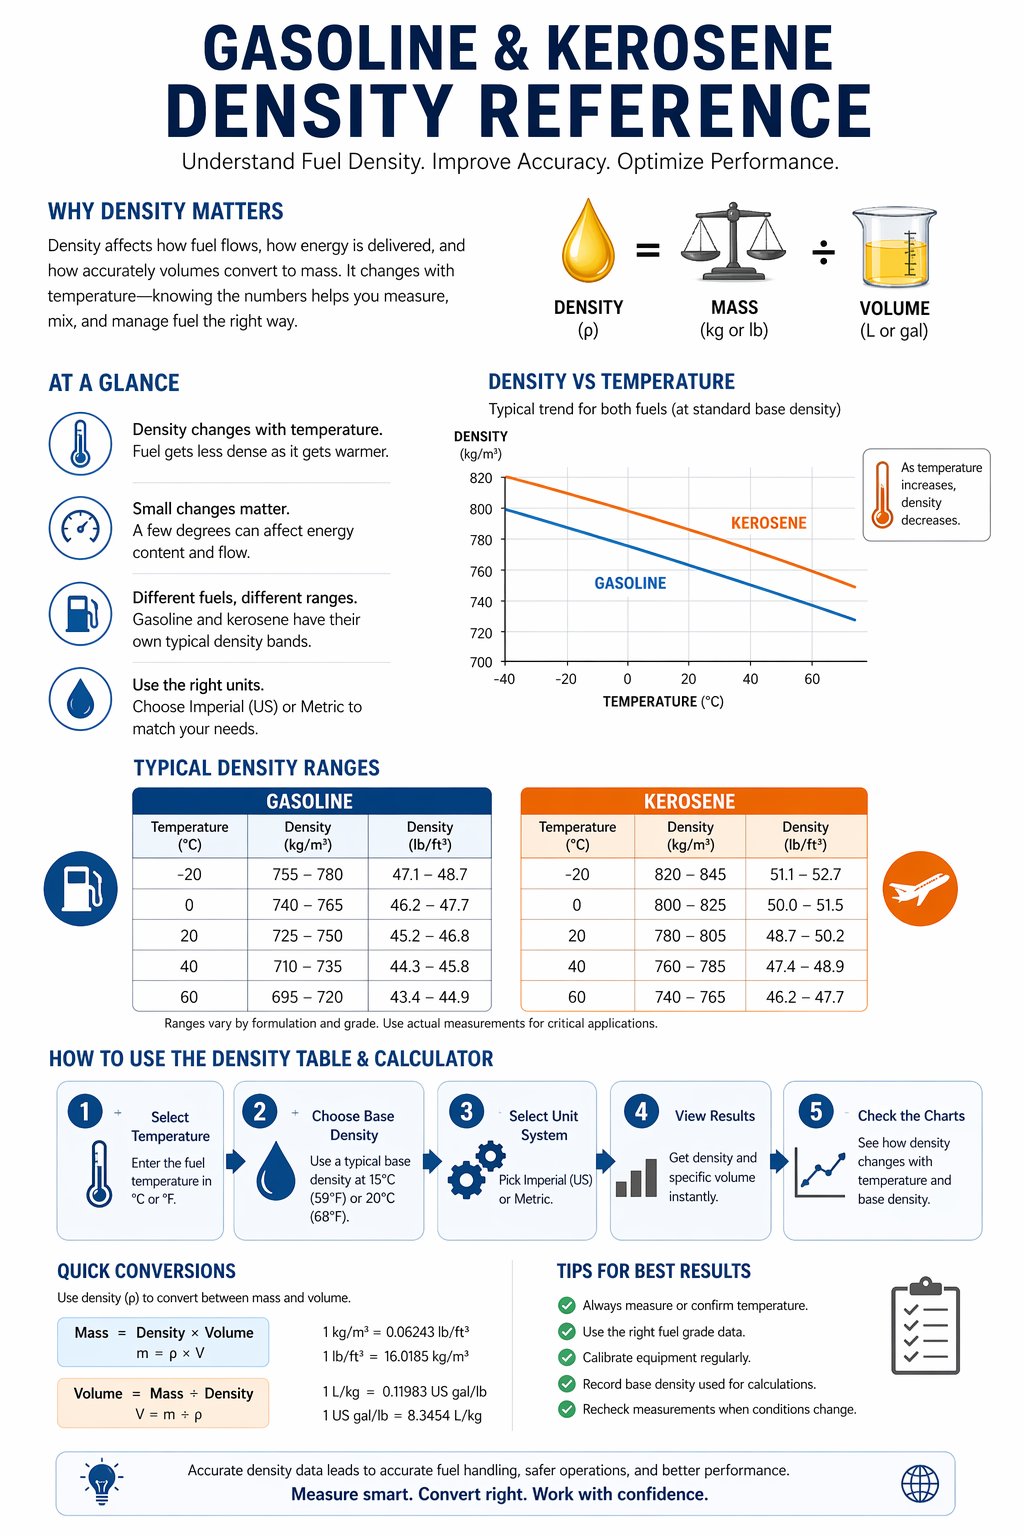
Gasoline and kerosene sit in different parts of the fuel world. Gasoline is usually lighter. Kerosene is usually heavier and more stable in cold weather. That difference shows up in density, in flow behavior, and in how the fuel is used.
Gasoline is commonly used in engines and automotive systems. Kerosene is often used in heating, lighting, aviation-related use, and general fuel storage work. Because the products are different, the reference values are different too. That is why a single fuel table is not enough.
The calculator is built around this exact idea. The user can compare values by fuel type, see the density change with temperature, and check a base density that matches the grade being used.
What the live graph adds
A table gives the number. A graph gives the trend. That is the whole point of the live chart.
When temperature changes, the curve moves. When the base density changes, the curve shifts too. That makes it much easier to understand what is happening than reading one fixed line in a table. The graph shows whether density is climbing or falling and how strong the shift is.
The red point marks the current value. That point is the one the user should trust for the current setup. The curve around it shows the pattern. Put together, they give a much better picture than a static number alone.
Imperial and Metric modes
This calculator supports both systems because fuel work in the United States often uses Imperial units, while many technical references still use Metric. Imperial is the default because that is the more natural fit for a US audience.
In Imperial mode, density appears in lb/ft³ and specific volume appears in US gal/lb. Temperature appears in °F. In Metric mode, density appears in kg/m³ and specific volume appears in L/kg. Temperature appears in °C.
That means the same calculator can serve both everyday US users and users who think in SI. No extra tool is needed. The user just flips the unit system and keeps going.
Reference table for gasoline
The table below gives approximate gasoline density values at 68°F for a range of base densities. It is a practical working guide, not a laboratory certificate. Real gasoline can vary by blend and season, so these values are best used for quick reference and comparison.
| Base density kg/m³ | Base density lb/ft³ | Specific volume m³/kg | Specific volume US gal/lb |
|---|---|---|---|
| 705 | 44.00 | 0.001418 | 0.133 |
| 720 | 44.94 | 0.001389 | 0.130 |
| 735 | 45.88 | 0.001361 | 0.127 |
| 740 | 46.19 | 0.001351 | 0.126 |
| 750 | 46.81 | 0.001333 | 0.125 |
| 760 | 47.44 | 0.001316 | 0.123 |
| 770 | 48.06 | 0.001299 | 0.122 |
| 780 | 48.69 | 0.001282 | 0.120 |
| 790 | 49.31 | 0.001266 | 0.119 |
| 800 | 49.94 | 0.001250 | 0.117 |
| 810 | 50.56 | 0.001235 | 0.116 |
| 820 | 51.18 | 0.001220 | 0.114 |
| 830 | 51.81 | 0.001205 | 0.113 |
| 840 | 52.43 | 0.001190 | 0.112 |
| 850 | 53.06 | 0.001176 | 0.110 |
Lower base density usually points to a lighter gasoline blend. Higher base density means a heavier blend. That is the main trend to watch in the table and on the graph.
Reference table for kerosene
The next table shows kerosene-style values at 68°F. Kerosene is usually denser than gasoline, so the numbers sit higher. That difference is one of the easiest ways to compare the 2 fuels at a glance.
| Base density kg/m³ | Base density lb/ft³ | Specific volume m³/kg | Specific volume US gal/lb |
|---|---|---|---|
| 770 | 48.06 | 0.001299 | 0.122 |
| 780 | 48.69 | 0.001282 | 0.120 |
| 790 | 49.31 | 0.001266 | 0.119 |
| 800 | 49.94 | 0.001250 | 0.117 |
| 810 | 50.56 | 0.001235 | 0.116 |
| 820 | 51.18 | 0.001220 | 0.114 |
| 830 | 51.81 | 0.001205 | 0.113 |
| 840 | 52.43 | 0.001190 | 0.112 |
| 850 | 53.06 | 0.001176 | 0.110 |
| 860 | 53.68 | 0.001163 | 0.109 |
| 870 | 54.30 | 0.001149 | 0.108 |
| 880 | 54.93 | 0.001136 | 0.106 |
| 890 | 55.55 | 0.001124 | 0.105 |
| 900 | 56.18 | 0.001111 | 0.104 |
| 910 | 56.80 | 0.001099 | 0.103 |
That table shows what many users already expect. Kerosene is heavier than gasoline. The same volume carries more mass. That is why density matters so much when the fuel type changes.
Temperature reference table in Imperial mode
This table shows how density changes with temperature in Imperial mode. It uses a common middle fuel density as a reference point. The exact value can move depending on the blend, but the trend stays the same. Warm fuel is lighter. Cold fuel is heavier.
| Temperature °F | Density lb/ft³ | Specific volume US gal/lb |
|---|---|---|
| -40 | 49.90 | 0.134 |
| -20 | 49.70 | 0.135 |
| 0 | 49.50 | 0.136 |
| 20 | 49.31 | 0.137 |
| 40 | 49.11 | 0.138 |
| 60 | 48.92 | 0.139 |
| 68 | 48.84 | 0.139 |
| 80 | 48.72 | 0.140 |
| 100 | 48.53 | 0.141 |
| 120 | 48.35 | 0.142 |
| 140 | 48.16 | 0.143 |
Temperature reference table in Metric mode
The same trend appears in Metric mode. The fuel density goes down as temperature goes up. This view is helpful for users who prefer SI or need a number that fits a metric report.
| Temperature °C | Density kg/m³ | Specific volume L/kg |
|---|---|---|
| -40 | 802.0 | 1.247 |
| -20 | 795.0 | 1.258 |
| 0 | 788.0 | 1.270 |
| 20 | 781.0 | 1.280 |
| 40 | 774.0 | 1.292 |
| 60 | 767.0 | 1.304 |
| 80 | 760.0 | 1.316 |
| 100 | 753.0 | 1.328 |
How to read the graph
The first graph shows density vs temperature. That is the best graph when the user wants to know how a fuel batch changes with heat or cold. The second graph shows density vs base density. That is the best graph when the user wants to compare different fuel grades or different fuel cuts.

The line gives the trend. The dot gives the current value. The crosshair helps the user line up the reading. That combination is better than a plain table because it answers both the exact question and the trend question at the same time.
Practical examples
Example 1, gasoline at room temperature
Set the unit system to Imperial. Choose a gasoline-style base density around 49.5 lb/ft³. Set the temperature to 68°F. The table will show a density close to the expected range for a typical gasoline blend.
Example 2, kerosene on a cold day
Set a kerosene-style base density around 52.5 lb/ft³. Lower the temperature. The graph will show the density rising slightly. That is the normal response to colder conditions.
Example 3, comparing 2 products
Put one value into the gasoline range and another into the kerosene range. The difference is easy to see on the table and on the graph. That makes it simpler to explain why the fuels are not interchangeable in every use case.
Why the base density matters
Base density is the starting point for the calculator. It is the reference density at 68°F in Imperial mode or 20°C in Metric mode. Once that starting point is set, the calculator can show how the reading shifts with temperature.
This matters because different fuel batches do not all start from the same place. Some gasoline is lighter. Some kerosene is heavier. The base density tells the calculator what kind of fuel it is dealing with before the temperature adjustment happens.
Quick formula examples
Here are a few simple working examples that users can keep in mind.
| Task | Formula | What it tells you |
|---|---|---|
| Find mass from volume | mass = density x volume | How much fuel is in the tank |
| Find volume from mass | volume = mass / density | How much space the fuel will occupy |
| Find specific volume | specific volume = volume / mass | How much space 1 unit of mass needs |
| Convert fraction to percent | percent = fraction x 100 | How to read a decimal value as % |
Common mistakes to avoid
| Mistake | What goes wrong | Better move |
|---|---|---|
| Mixing Imperial and Metric values | The reading becomes confusing | Keep one mode active at a time |
| Using the wrong base density | The result does not match the fuel type | Choose a value that fits gasoline or kerosene |
| Ignoring temperature | The density estimate is incomplete | Set the temperature before reading the table |
| Reading the graph without the point | The trend is visible but the exact value is missed | Use both the point and the curve |
| Assuming every fuel behaves the same | Gasoline and kerosene get treated like one product | Use the table that matches the fuel |
Fuel handling is full of small details. A tank reading can change with temperature. A batch can vary by product type. A transfer can look fine on paper but still need a density check. That is why a reference like this matters. This calculator keeps the process simple. It does not bury the user in technical language. It shows the current value, the trend, and the working unit system. That makes it easier to check a number before using it in a report, a note, or a transfer estimate.
Short takeaway table
| Fuel | General density behavior | Practical note |
|---|---|---|
| Gasoline | Usually lighter | Good for vehicle fuel reference and batch checks |
| Kerosene | Usually heavier | Good for heating fuel and storage reference |
| Warm fuel | Lower density | Same volume weighs less |
| Cold fuel | Higher density | Same volume weighs more |
FAQ
Why does fuel density change with temperature?
Because liquids expand and contract as temperature changes. That changes how much mass fits into the same volume.
Why are gasoline and kerosene separate?
Because they are not the same product. Their density ranges are different and their use cases are different.
Why is Imperial the default?
Because the calculator is designed for a US audience first, and Imperial units are the more familiar display for many users.
What is specific volume?
It is the amount of volume tied to 1 unit of mass. It is the inverse view of density.
Can this be used for quick estimates?
Yes. That is exactly what it is built for.
References
- ASTM fuel property references
- Standard petroleum handbooks
- National and industry fuel density tables
- General liquid fuel reference materials
- Practical storage and handling guides for gasoline and kerosene

David Parry — Senior Engineering Analyst
Specializing in electronics and physics-based simulations with 20+ years of engineering experience. David ensures the mathematical and physical accuracy of the tools at ProCalcLab.


