| Daily values | |
|---|---|
| Maximum power | - |
| Panel efficiency | - |
| Daily output | - |
Solar panels work best when the surface angle, direction, weather, and panel area all line up in a useful way. A panel that looks perfect on paper can still underperform if it is mounted too flat, aimed the wrong way, or sized without enough real-world margin. This calculator helps estimate how much power a solar panel setup can produce based on area, peak output, tilt, azimuth, cloud cover, and month.


🌤 The goal is simple. Enter the panel size, choose the panel output rating, set the tilt and direction, then look at the estimated maximum power, panel efficiency, and daily energy output. The calculator is built for quick planning, comparison, and rough sizing. It is not a lab instrument, but it is very useful for checking ideas before buying panels or mounting hardware.
Table of Contents
What this calculator is for
This tool is meant for people who want a practical estimate, not a perfect engineering simulation. It is useful for:
- Checking how much energy a rooftop or ground-mounted panel setup might produce
- Comparing one panel angle against another
- Comparing a south-facing layout with a roof that points east, west, or somewhere in between
- Seeing how clouds and season change output
- Estimating whether a panel area is large enough for the target load
The calculator is designed for American users by default, so it starts with imperial units. That means area is shown in square feet and peak output is shown in watts per square foot. A metric toggle is included for users who prefer square meters and watts per square meter.
How to use it
Start with the unit selector. Keep Imperial selected if the project is being planned in square feet. Switch to Metric if the panel area is easier to think about in square meters. The tool updates the labels automatically.
Next, enter the panel area. This is the total active surface area of the solar array, not the footprint of the rack or the roof section. If the module has gaps between sections, use the real collecting area, not the full platform size.
Then enter peak output per area. In American use, this is often easier to think of as watts per square foot. If metric units are selected, the same field becomes watts per square meter.
After that, set:
- Tilt — the panel slope from flat to vertical
- Azimuth — the horizontal direction the panel faces
- Cloud cover — estimated cloud loss in percent
- Month — the month that best matches the expected sun position
The calculator then shows three results:
- Maximum power — the theoretical peak power based on panel area and output density
- Panel efficiency — a simplified efficiency estimate based on tilt, direction, season, and clouds
- Daily output — estimated daily energy production in kWh

What each input means
| Input | What it means | What to enter | Typical use |
|---|---|---|---|
| Units | Measurement system | Imperial or Metric | Imperial for US users, Metric for international users |
| Peak output | Power density of the panel surface | Watts per ft² or watts per m² | Used to estimate maximum power |
| Area | Active collecting surface | ft² or m² | Total panel surface that receives sunlight |
| Tilt | Panel slope | 0° to 90° | Roof pitch, rack angle, or ground mount angle |
| Azimuth | Direction the panel faces | -90° to 90° | 0° means a centered facing direction, left or right means offset |
| Cloud cover | Loss from weather | 0% to 100% | Higher cloud value means lower output |
| Month | Season reference | 1 to 12 | Used to adjust sun angle and daylight estimate |
How the main results should be read
| Result | What it shows | How to interpret it | Why it matters |
|---|---|---|---|
| Maximum power | Estimated peak power from area and power density | Higher number means more solar collection potential | Useful for sizing |
| Panel efficiency | Relative output after tilt, direction, season, and cloud adjustment | Closer to 100% means a better match to conditions | Useful for comparing layouts |
| Daily output | Estimated energy over a day | Shown in kWh | Useful for planning battery charging and load support |
Simple formulas used by the calculator
The math is intentionally easy to follow.
Maximum power = panel area × peak output per area
Efficiency = seasonal factor × tilt factor × cloud factor × 100
Daily energy = maximum power × sun hours × efficiency / 1000
That is the short version. The calculator uses these values to keep the results readable and practical. It is not trying to replace a full solar design package. It is trying to give a fast estimate that makes sense to a homeowner, DIY builder, or project planner.
Example values in imperial units
| Panel area ft² | Peak output W/ft² | Maximum power W | Typical use |
|---|---|---|---|
| 25 | 15 | 375 | Small rooftop section |
| 50 | 18 | 900 | Small home array |
| 100 | 19 | 1900 | Medium setup |
| 150 | 20 | 3000 | Larger roof section |
| 250 | 21 | 5250 | Large residential or small off-grid bank |
Example values in metric units
| Panel area m² | Peak output W/m² | Maximum power W | Typical use |
|---|---|---|---|
| 2 | 180 | 360 | Small test panel |
| 5 | 200 | 1000 | Starter setup |
| 10 | 210 | 2100 | Mid-size array |
| 15 | 220 | 3300 | Large home system |
| 25 | 225 | 5625 | High output array |
How tilt affects output
Tilt is one of the easiest things to control, and one of the easiest things to get wrong. A panel laid too flat can lose performance in winter. A panel set too steep can underperform in summer. The best tilt is not always the same for every month, and that is why the month selector matters. For simple planning, think of tilt this way:
- Flat mounting can work on some roofs, but it usually is not ideal
- Medium tilt often gives the best balance across the year
- Steeper tilt helps winter sun capture but can hurt summer performance
The calculator uses a simplified seasonal tilt estimate so users can compare choices quickly. The idea is not to find a perfect installation angle for every zip code. The idea is to see whether the current setup is close enough or way off.
How azimuth affects output
Azimuth is the direction the panel faces. In plain language, it is the left or right aim of the array. If the panel is facing the wrong direction, the system may still work, but the daily output will drop.
👉 For many US installations, a south-facing array is often the practical baseline. However, east-facing and west-facing systems can still be useful, especially when roof shape limits the layout or when the goal is morning or afternoon production. The calculator lets the user test this quickly by changing azimuth and watching the estimated output shift.
| Azimuth value | Practical meaning | Expected effect |
|---|---|---|
| 0° | Centered direction | Baseline for the calculator |
| 15° | Slight offset | Small loss |
| 30° | Moderate offset | Noticeable loss |
| 45° | Strong offset | Clear reduction in output |
| 90° | Very strong offset | Much lower useful output |
How clouds are treated
Cloud cover is entered as a percentage. Higher cloud values reduce the estimated output. This makes the calculator useful for rough daily planning when weather is not perfect. It is not a weather app. It is a planning tool that shows how cloudy conditions reduce usable energy.
👉 A low cloud value means a clearer day and better output. A high cloud value means the panel will still produce power, but less of it. This is important because many users assume solar is either fully on or fully off. In reality, solar output fades with weather changes instead of disappearing all at once.
How the month setting helps
The month selector changes the seasonal estimate. Sun height, day length, and angle all vary over the year. That means a roof that looks good in summer may not be ideal in winter, and a panel that works well in June may need a different angle in December. The month field helps the user test that change without doing a full solar study.
| Month range | General pattern | Practical meaning |
|---|---|---|
| 1 to 3 | Lower sun and shorter days | Winter-style output |
| 4 to 6 | Sun climbs higher | Output begins improving |
| 7 to 9 | Strong summer production | Often the easiest period for solar collection |
| 10 to 12 | Sun lowers again | Output usually falls |
Good ways to use the calculator
This tool becomes more useful when it is used more than once. A single result is fine, but comparison is where the value really comes out. Test one tilt, then another. Test one azimuth, then another. Test a clear month, then a cloudy month. The difference between the results is often more useful than the absolute number.
- Compare roof angle against a ground rack
- Compare east-facing and south-facing layouts
- Compare summer production against winter production
- Compare a clear day against a partly cloudy day
If a system is being planned for battery charging, use the daily output number to estimate how much energy can be stored or consumed. If the system is being planned for a home load, compare the daily output against the expected daily use. If the numbers are close, the setup may need more panel area or better mounting conditions.
Quick reading guide
| If the result looks like this | What it usually means | What to try next |
|---|---|---|
| High maximum power, low efficiency | The array is large, but the mounting conditions are weak | Adjust tilt, azimuth, or cloud estimate |
| Good efficiency, low daily output | The panel alignment is fine, but the array is too small | Add more panel area |
| Large daily output | The setup is strong enough for meaningful energy production | Check real-world losses before final design |
| Low daily output | The array is probably too small or too poorly oriented | Test a better angle or larger area |
Best practices for getting useful results
- Use the real collecting surface, not the roof footprint
- Enter a realistic cloud value, not a perfect-weather guess
- Test more than 1 month if the system will run year-round
- Check both common angles and the actual roof pitch
- Compare imperial and metric only if it helps the planning process
When the numbers are close, the safest choice is usually the one that gives more margin. That can mean a little more panel area, a better angle, or a less shaded mounting location. Solar planning is often about reducing the weak spots before the equipment is installed.
Example planning scenarios
| Scenario | What to test | What the calculator helps answer |
|---|---|---|
| Small cabin | Area, winter month, cloud cover | Whether the array can support daily loads |
| Rooftop retrofit | Tilt, azimuth, panel area | Whether the existing roof slope is good enough |
| Battery charging system | Daily output, clouds, month | How much charging energy may be available |
| Ground mount | Tilt, direction, area | Which rack angle gives better output |
| Seasonal comparison | Same setup in different months | How much production changes across the year |
Reference notes for users in the US
For US users, panel area is often easier to think about in square feet, especially when working from roof dimensions. Panel power, inverter ratings, and battery charging values are still usually expressed in watts and kilowatt-hours. That is why the calculator keeps power in watts and energy in kWh while allowing the area unit to switch.
A practical workflow is:
- Measure the available roof or rack area in ft²
- Enter a realistic power density in W/ft²
- Check the output at 2 or 3 tilt values
- Compare a clear month and a poor month
- Decide whether the array size needs adjustment
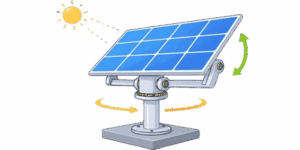
Reading the 3D display and gauges
The visual part of the calculator is there for more than decoration. The 3D solar panel view gives a simple picture of tilt and direction. The gauges show current power and daily energy in a way that is easy to scan. The visual display is useful when testing values because small changes become easier to notice.
When the tilt changes, the panel angle changes. When the azimuth changes, the panel turns. When clouds increase, the production estimate drops. That makes the calculator easier to understand at a glance, especially for users who prefer a visual check before reading the numbers.
Why this kind of calculator is useful
Solar planning often starts with rough questions. How much panel area is enough. Is the roof angle acceptable. Will the array still work in winter. Is the setup worth building at all. A calculator like this gives a quick answer to those questions without forcing the user to build a full engineering model first.

It is especially helpful when comparing options side by side. A user can change one value at a time and see the effect immediately. That makes it easier to spot whether the biggest gain comes from more area, a better tilt, or simply a cleaner exposure to the sun.
Short summary
This calculator estimates solar panel peak power, relative efficiency, and daily energy output using a simple set of inputs. It starts in Imperial mode for American users, with an option to switch to Metric. Use it to compare panel sizes, test tilt and azimuth, and get a fast rough estimate before final solar planning.
Literature
- U.S. Department of Energy, Office of Energy Efficiency and Renewable Energy. Solar Energy Basics.
- NREL, National Renewable Energy Laboratory. PVWatts Calculator Documentation.
- NREL. Best Practices for Solar Photovoltaic System Design.
- Sandia National Laboratories. Photovoltaic Performance Parameters and Field Measurements.
- SEIA, Solar Energy Industries Association. Residential Solar Basics.
- U.S. Department of Energy. Guide to Home Solar Energy Systems.

David Parry — Senior Engineering Analyst
Specializing in electronics and physics-based simulations with 20+ years of engineering experience. David ensures the mathematical and physical accuracy of the tools at ProCalcLab.


