
Major scheduling errors almost always originate from treating all time as identical. A standard week contains 168 hours. However, a working week yields only 40 hours. Failing to account for this 128 hour discrepancy destroys deadlines and causes severe budget overruns. This advanced dashboard bridges the gap between abstract calendar dates and actionable scheduling metrics.



⏱ Operating a visual time calculator removes heavy cognitive loads. When scheduling tasks shift from internal mental effort to external digital tools, mental focus remains available for actual productive labor. This transition proves especially critical for project managers, logistics coordinators, and independent contractors working with complex interval metrics, where precision down to 1 minute determines final profitability.
Table of Contents
Navigating the Advanced Dashboard Interface
The interface provides a clean workspace devoid of confusing spreadsheet formulas. The tool relies on simple inputs to generate complex analytical outputs. The primary input sector contains 6 independent sliders corresponding to standard metrics: years, weeks, days, hours, minutes, and seconds. Adjusting a slider yields an immediate visual update, while typing a digit directly into the adjacent box guarantees absolute precision.

The core engine features 2 operational settings located at the top of the board. The Calendar mode calculates every ticking second regardless of weekends or holidays. The Business mode applies strict corporate logic, stripping away non-working hours to reveal true productive capacity. Switching between these 2 options forces the system to instantly recalculate all downstream values.
A dedicated interval sector sits below the main inputs. Establishing a specific block size here tells the system to divide the massive time total into bite-sized, manageable chunks. The visual analytics board then renders these calculations into an intuitive graphical stream, transforming raw digits into a clear roadmap.
Calendar Logic Versus Business Logic
Understanding the mathematical divide between standard time and corporate time eliminates the most common planning failures. Calendar logic remains relentless and uniform. 1 year invariably equals 365 days. 1 day always equals 24 hours. Nature operates on this scale, making it ideal for tracking biological processes, shipping transit times, or server uptimes.
📝 Business logic reflects human endurance and labor laws. American corporate scheduling relies on a much smaller subset of available hours. 1 business day equals exactly 8 hours. 1 business week contains 5 days, yielding exactly 40 hours. 1 business year typically spans 250 working days, accounting for 104 weekend days and 11 standard federal holidays.
Table 1: Calendar Time Constants
| Calendar Unit | Equivalent in Hours | Equivalent in Seconds |
|---|---|---|
| 1 Standard Year | 8760 | 31536000 |
| 1 Standard Week | 168 | 604800 |
| 1 Standard Day | 24 | 86400 |
| 1 Standard Hour | 1 | 3600 |
Table 2: Corporate Business Time Constants
| Corporate Unit | Equivalent Working Hours | Equivalent Working Seconds |
|---|---|---|
| 1 Working Year | 2000 | 72000000 |
| 1 Working Week | 40 | 144000 |
| 1 Working Day | 8 | 28800 |
| 1 Working Hour | 1 | 3600 |
The Mathematics of Time Conversion
The calculation engine relies on a universal base unit to ensure flawless accuracy. Seconds serve as this foundational metric. Every larger value undergoes a multiplication process to reach its value in seconds. The system then aggregates these separate values into 1 grand total.
The base formula for Calendar mode relies on standard physical constants:
Ttotal = Y * 31536000 + W * 604800 + D * 86400 + H * 3600 + M * 60 + S
The formula for Business mode replaces physical constants with labor constants:
Tbiz = Y * 72000000 + W * 144000 + D * 28800 + H * 3600 + M * 60 + S
To determine how many specific task blocks fit within the designated deadline, the engine divides the grand total by the defined interval duration:
Icount = Ttotal / Ival
Practical Application Scenario
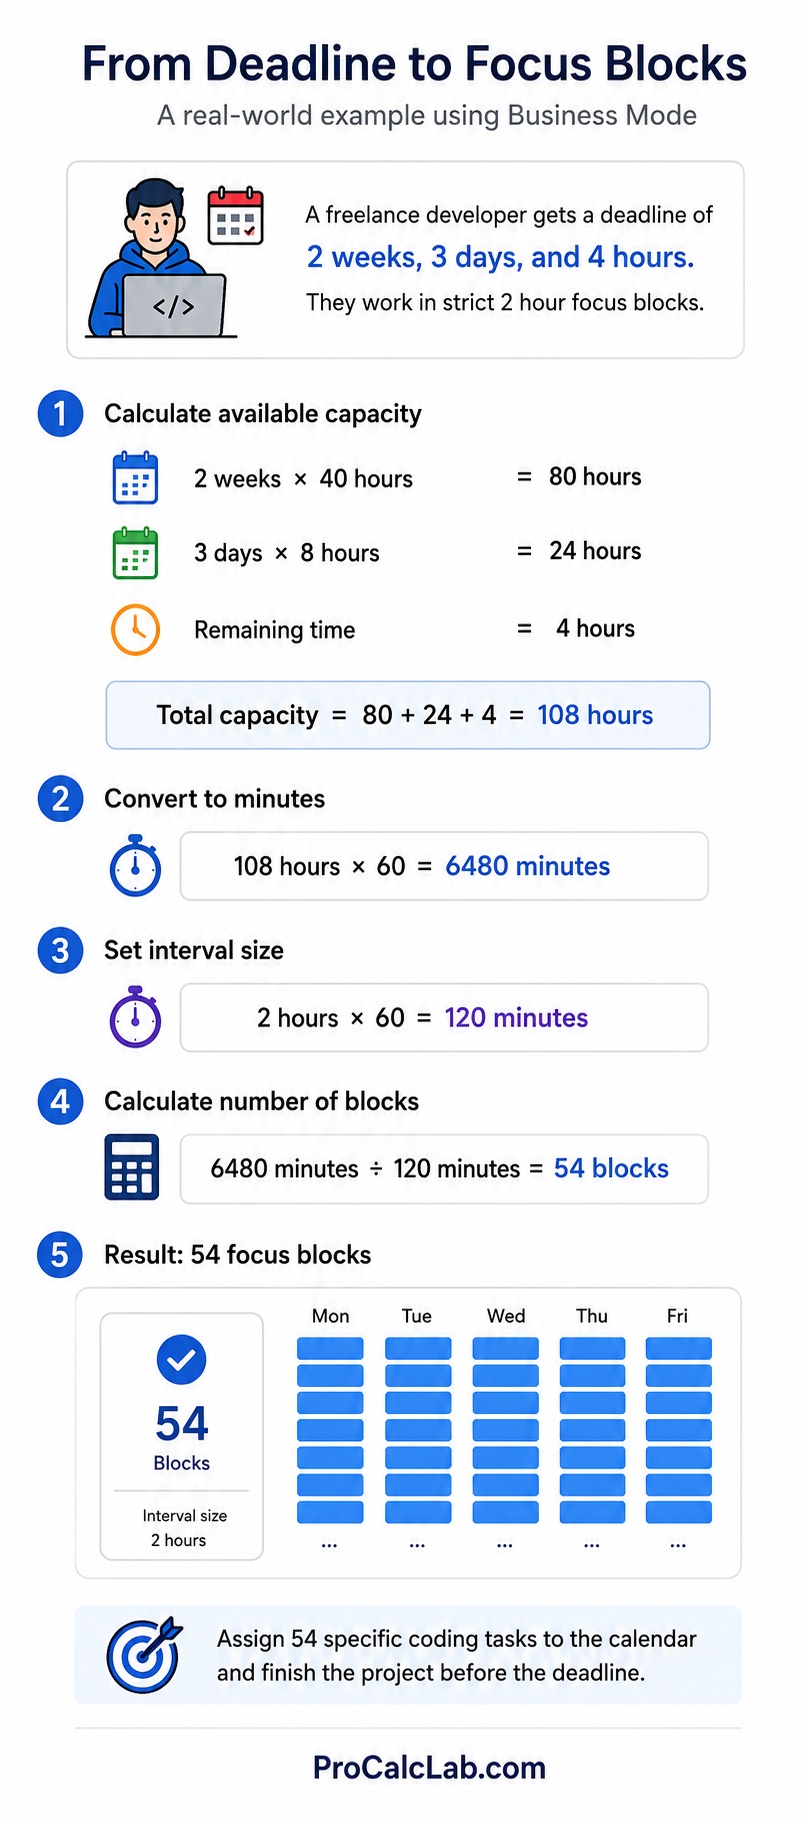
Real-world application demonstrates the true value of the tool. Consider a freelance developer estimating a software sprint. The client provides a deadline of 2 weeks, 3 days, and 4 hours. The developer works in strict 2 hour focus blocks.
Using the Business mode ensures accurate capacity mapping. The developer inputs the numbers.
- 2 weeks * 40 hours = 80 hours
- 3 days * 8 hours = 24 hours
- Remaining time = 4 hours
The total available capacity equals 80 + 24 + 4 = 108 hours. The system converts this into minutes to ensure proper fractional division.
108 * 60 = 6480 minutes.
The developer set the interval size to 2 hours. 2 * 60 = 120 minutes.
The final interval count emerges through simple division: 6480 / 120 = 54 blocks.
The dashboard displays exactly 54 functional blocks. The developer can now assign exactly 54 specific coding tasks to the calendar, ensuring the project finishes safely before the deadline hits.
The Psychology of Estimation Errors
Planners constantly face the planning fallacy. Tasks invariably take longer than anticipated because individuals envision a seamless, uninterrupted workflow. Real life introduces constant friction. Phone calls, software updates, and fatigue constantly degrade efficiency.
Using a strict business time calculator forces professionals to acknowledge hard limits. A standard office day only yields 8 hours of theoretical capacity. Subtracting breaks, meetings, and transition periods often leaves only 5 or 6 hours of true focus. Building schedules based on 24 hour calendar days guarantees burnout and failure. Integrating realistic metrics into the dashboard prevents these disastrous outcomes.
Interval Mapping and Productivity Optimization
Tracking time in intervals resembles managing a financial budget. Every minute acts as currency. Spending 40 minutes on a low-priority task burns valuable resources that a critical project requires. The interval distribution map reveals exactly how many blocks exist within a deadline.
✍ Different tasks demand different interval sizes. Repetitive administrative duties respond well to short sprints. Complex problem-solving requires extended deep work sessions. Adapting the interval size to the task type maximizes mental stamina.
Table 3: Common Interval Strategies
| Strategy Name | Active Duration | Optimal Application Target |
|---|---|---|
| Micro Sprint | 15 minutes | Repetitive data entry or inbox zero |
| Standard Block | 25 minutes | Focused reading or code review |
| Deep Work | 90 minutes | Complex writing or system architecture |
| Half Shift | 4 hours | Major project milestones or creative flow |
Visualizing Abstract Data
Visual analytics transform abstract numbers into digestible formats.
- The macro scale progress bar illustrates long-term goals. Seeing a multi-year project translated into a percentage line grounds expectations and highlights the true scope of an undertaking.
- The medium scale covers weeks and days. This perspective aligns perfectly with agile project management methodologies. Tracking sprint progress on a 7 day or 14 day bar keeps teams motivated and aware of impending deliverables.
- The micro scale addresses hours and minutes. Daily productivity relies entirely on managing this specific scale. Watching the micro bar fill up enforces discipline and discourages procrastination during active intervals.
Literature
Mastering workflow optimization requires continuous study. The following English publications offer tested methodologies, mathematical approaches, and psychological insights regarding personal efficiency and corporate scheduling.
- Cal Newport, Deep Work, 2016. A profound exploration of maintaining intense focus in a world filled with digital distractions.
- David Allen, Getting Things Done, 2001. The definitive framework for capturing tasks, processing workflows, and reducing mental clutter.
- Jeff Sutherland, Scrum The Art of Doing Twice the Work in Half the Time, 2014. A practical guide to agile methodologies, interval sprinting, and eliminating wasteful processes.
- James Clear, Atomic Habits, 2018. A scientific breakdown of how tiny daily routines compound over months and years to yield massive results.
- Greg McKeown, Essentialism, 2014. A strategic approach to identifying the most valuable tasks and aggressively eliminating everything else.
- Brian Tracy, Eat That Frog, 2001. Actionable advice on prioritizing the most difficult daily tasks to ensure consistent forward momentum.
- Timothy Ferriss, The 4 Hour Workweek, 2007. Radical strategies for automating labor, defining strict productivity blocks, and maximizing output per hour.

David Parry — Senior Engineering Analyst
Specializing in electronics and physics-based simulations with 20+ years of engineering experience. David ensures the mathematical and physical accuracy of the tools at ProCalcLab.